Project Dashboards, Scorecards and Performance Graphs
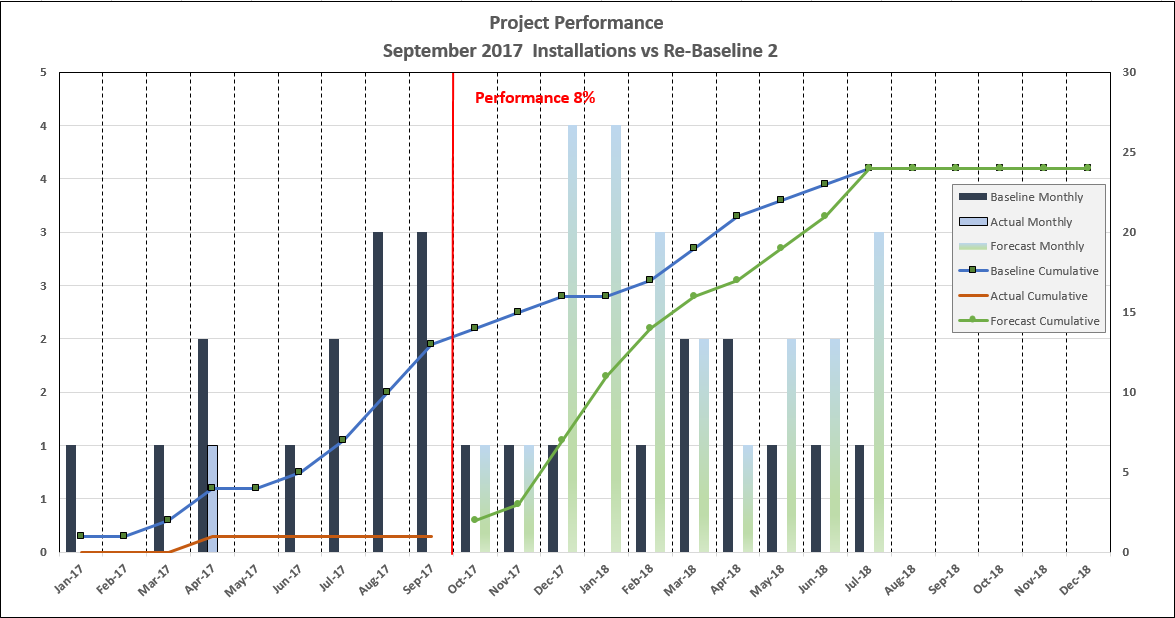
Performance graphs can be helpful for validating schedule projections submitted from a supplier or from the field. In this case (taken from actual Primavera P6 data), the supplier has thus far progressed at only 8% of the productivity expected by the project baseline. By some feat of magic, the supplier now forecasts that future progress (beginning in October) will be on the order of 300% of the productivity expected by the project baseline, such that the project will still complete on time. This would require a 3750% increase in productivity (300%/8% = 37.5)over what the supplier has historically been able to achieve thus far. We can never take what is presented in a schedule on face value. This supplier has some explaining to do. A good project controls team would have sent up a red flag for the Project Manager a good 5 or 6 months prior.