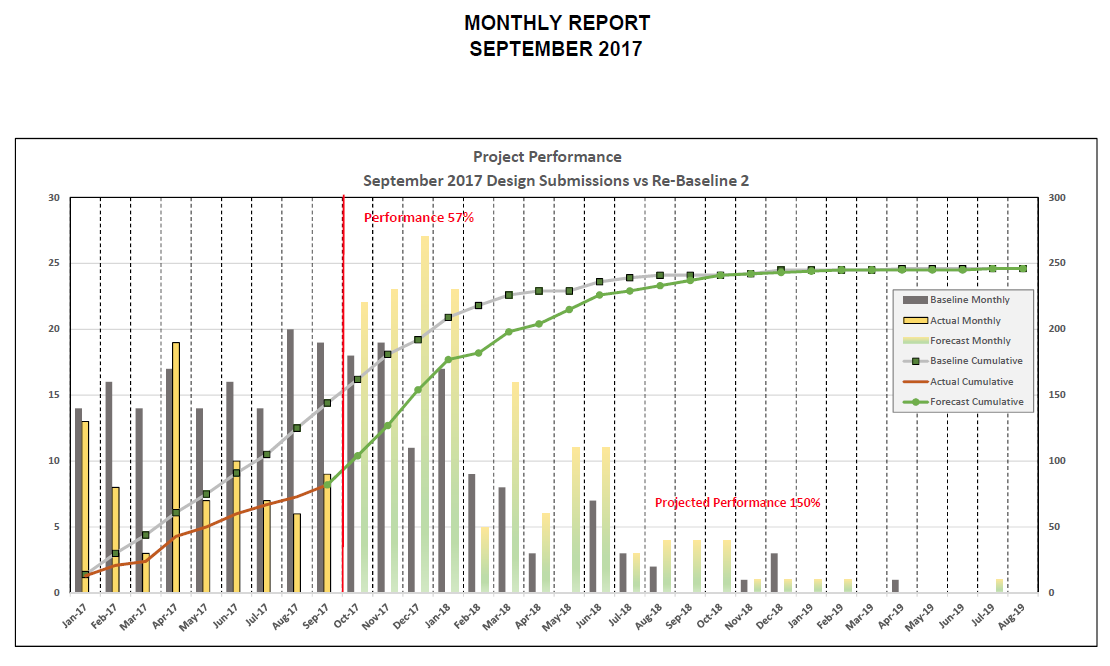
This one (again taken from actual P6 data) looks a little more reasonable, but it still forecasts future productivity at nearly 3 times the supplier's current productivity to date (150% of baseline versus 57% of baseline). The forecasted end date is still very much in question. The supplier needs to explain how they intend to acheive this forecast, and then needs to demonstrate immediate steps in that direction.

Tabular reports can be helpful as well. The one shown here is in draft form, with the narrative, analysis and initiatives sections not yet filled in. There seems to be some confusion as to the meaning of an "estimate at completion" (EAC) in the columns at right. An EAC is a forecast date or cost at completion, not a scheduled completion date. The 3 month look ahead shows the forecast progress falling even further behind the baseline plan than it is now. Target completion is for 2672 milestones. The forecast rate indicated by the 3 month look ahead is 149 milestones per quarter (330 forecast less 181 actual). If this rate were to continue as forecast, completion would be sometime in 2021, not 2018. We need to see some supporting explanation for how this supplier is able to forecast a 2018 completion. Perhaps the "initiatives" section will provide this when it is eventually filled in.